
Business
Mapped: The Uneven Recovery of U.S. Small Businesses

Mapped: The Uneven Recovery of U.S. Small Businesses
Small businesses are the backbone of the U.S. economy, employing nearly half of the private sector workforce.
Unfortunately, lockdown and work-from-home measures brought about by COVID-19 have disproportionately affected small businesses – particularly in the leisure and hospitality sectors.
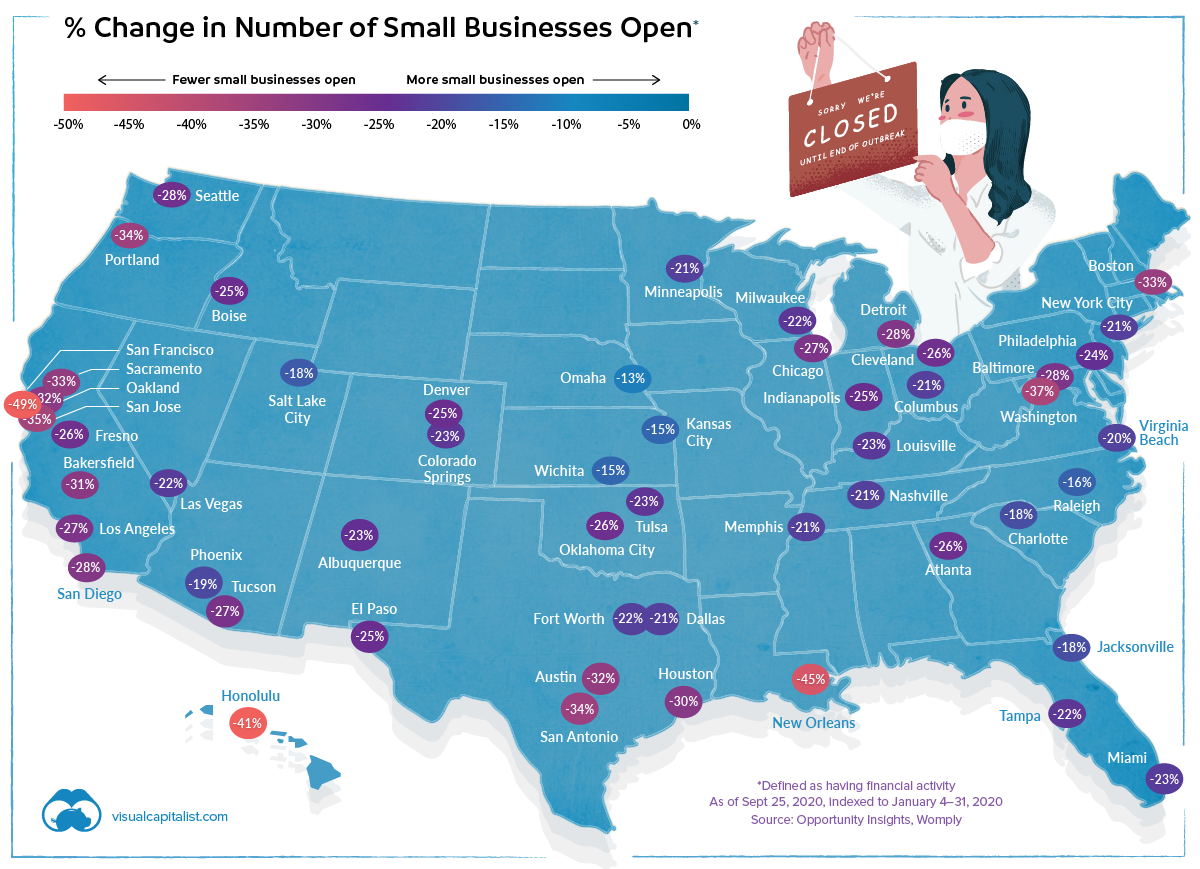
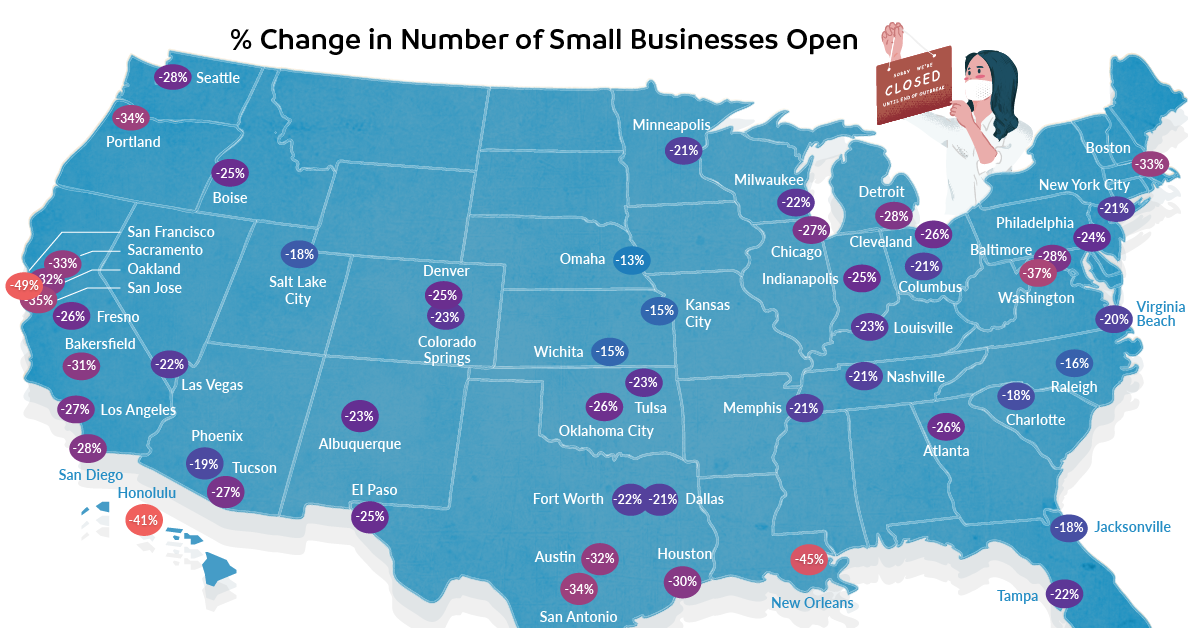
As metro-level data from Opportunity Insights points out, geography makes a great deal of difference in the proportion of U.S. small businesses that have flipped their open sign. While some cities are mostly back to business as usual, others are in a situation where the majority of small businesses are still shuttered.
The Big Picture
In the U.S. as a whole, data suggests that nearly a quarter of all small businesses remain closed. Of course, the situation on the ground differs from place to place. Here’s how cities around the country are doing, sorted by percentage of small businesses closed as of September 2020:
| Metros | Small Businesses Closed | Small Businesses Closed (Leisure & Hosp.) |
|---|---|---|
| San Francisco | -49% | -65% |
| New Orleans | -45% | -72% |
| Honolulu | -41% | -39% |
| Washington DC | -37% | -55% |
| San Jose | -35% | -41% |
| Portland | -34% | -46% |
| San Antonio | -34% | -60% |
| Sacramento | -33% | -43% |
| Boston | -33% | -42% |
| Oakland | -32% | -52% |
| Austin | -32% | -65% |
| Bakersfield | -31% | -64% |
| Houston | -30% | -58% |
| Seattle | -28% | -47% |
| San Diego | -28% | -41% |
| Baltimore | -28% | -43% |
| Detroit | -28% | -44% |
| Los Angeles | -27% | -39% |
| Chicago | -27% | -37% |
| Tucson | -27% | -37% |
| Atlanta | -26% | -33% |
| Fresno | -26% | -50% |
| Oklahoma City | -26% | -56% |
| Cleveland | -26% | -39% |
| Denver | -26% | -56% |
| Indianapolis | -25% | -29% |
| Denver | -25% | -38% |
| El Paso | -25% | -34% |
| Philadelphia | -24% | -34% |
| Tulsa | -23% | -40% |
| Albuquerque | -23% | -42% |
| Colorado Springs | -23% | -37% |
| Louisville | -23% | -25% |
| Miami | -23% | -38% |
| Fort Worth | -22% | -34% |
| Las Vegas | -22% | -35% |
| Tampa | -22% | -45% |
| Milwaukee | -22% | -30% |
| New York City | -21% | -40% |
| Dallas | -21% | -38% |
| Memphis | -21% | -37% |
| Minneapolis | -21% | -36% |
| Nashville | -21% | -39% |
| Columbus | -21% | -35% |
| Phoenix | -19% | -36% |
| Jacksonville | -18% | -35% |
| Salt Lake City | -18% | -24% |
| Charlotte | -18% | -42% |
| Raleigh | -16% | -34% |
| Wichita | -15% | -29% |
| Kansas City | -15% | -24% |
| Omaha | -13% | -14% |
New Orleans and the Bay Area are still experiencing rates of small business closures that are almost double the national median.
Small businesses in the leisure and hospitality sector have been particularly hard hit, with 37% reporting no transaction data.
Getting Back to Business
Some cities are seeing rates of small business operation that are nearing pre-pandemic levels.
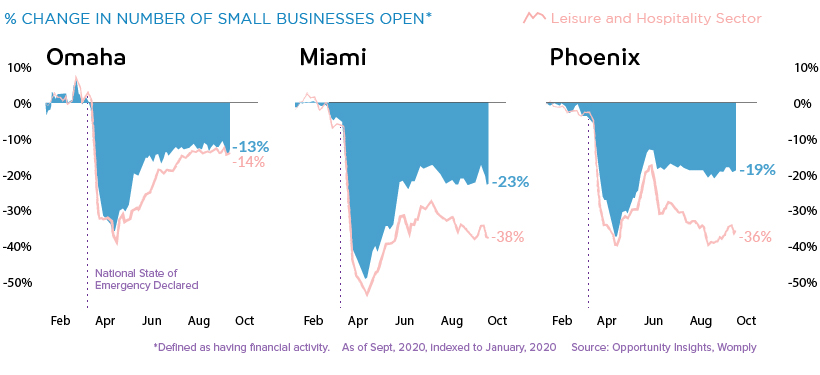
Of the cities covered in the data set, Omaha had the highest rate of small businesses open.
Still Shuttered
In cities with a large technology sector, such as San Francisco and Austin, COVID-19 is shaking up the economic patterns as entire companies switched to remote working almost overnight. This is bad news for the constellation of restaurants and services that cater to those workers.
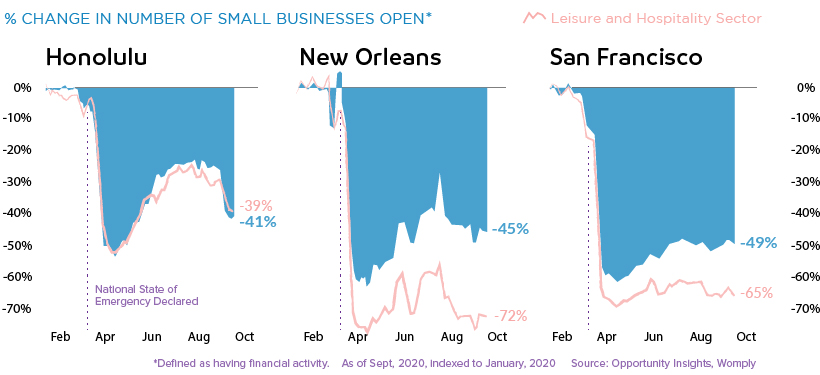
Likewise, cities that have an economy built around serving visitors – Honolulu and New Orleans, for example – have seen a very high rate of small business closures as vacations and conferences have been paused indefinitely.
As the pandemic drags on, many of these temporary closures are looking to be permanent. Yelp recently reported that of the restaurants marked as closed on their platform, 61% are shut down permanently. As well, businesses in the retail and nightlife categories also saw more than half of closures become permanent.
In Remembrance of Revenue
A business being completely closed is a definitive measure, but it doesn’t tell the whole story. Even for businesses that remained open, revenue is often far below pre-pandemic rates.
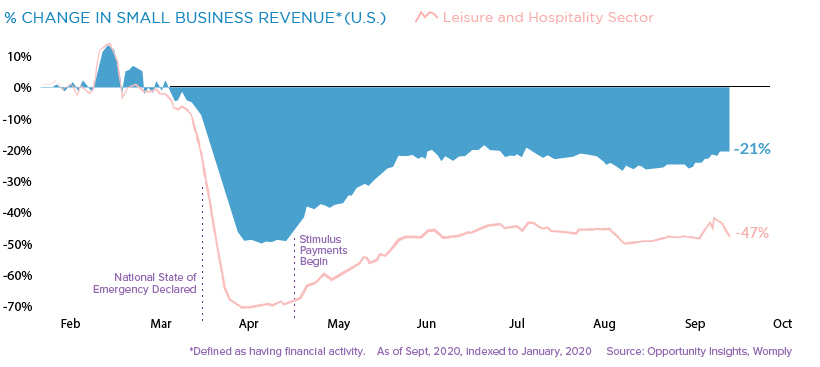
Once again, businesses in the leisure and hospitality sector have been hit the hardest, with revenue falling by almost half since the beginning of 2020.
At present, it’s hard to predict when, or even if, economic activity will completely recover. Though travel and some level of in-office work will eventually ramp back up, the small business landscape will continue to face major upheaval in the meantime.


Money
A Very COVID Christmas: The Pandemic’s Impact on Festive Spending
This graphic explores how festive spending in 2020 has changed as a result of the ongoing COVID-19 pandemic and evolving consumer behavior.

The Pandemic’s Impact on Festive Spending
View the high-resolution of the infographic by clicking here.
From mass job losses to not seeing family and friends for months on end, the COVID-19 pandemic has pushed people to their limits in 2020.
As an incredibly difficult year draws to a close, people are starting to accept that this festive season will be anything but typical. But while a portion of consumers have reined in their spending due to financial uncertainty, others are spreading Christmas cheer by indulging in gifts for their loved ones.
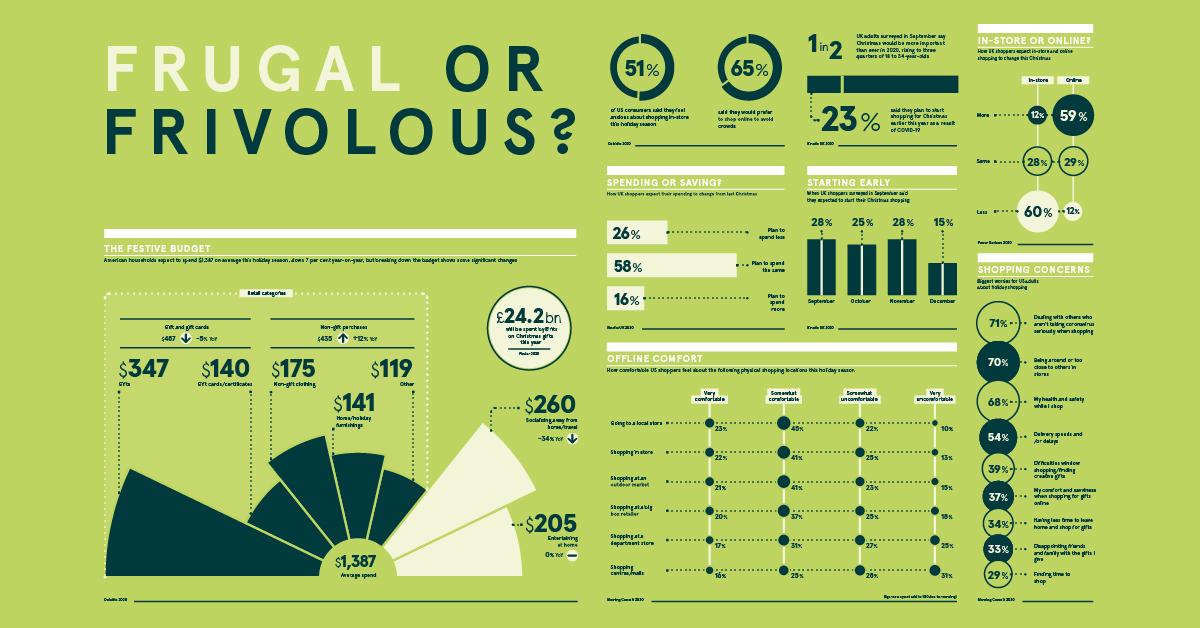
The graphic above from Raconteur explores how consumers’ festive spending in the U.S. and UK has changed as a result of the ongoing pandemic.
Will the shift trigger permanent changes in the retail industry?
Festive Budget Breakdown
According creative agency Kinetic, half of all UK adults surveyed believe this Christmas is more important than ever before, with that figure rising to three quarters for 18-34 year olds.
However, given consumers’ concerns over the future of the economy, they are expected to reduce spending during the festive season. In the U.S. for example, spending will decline by 7% to $1,387 per household.
When it comes to how consumers plan to spend their hard-earned cash, some interesting insights emerge. As many have saved significantly on socializing and travel—which is down 34% year-on-year—they plan to put this money towards items for themselves instead of gifts and gift cards for others. These items include clothes, at-home entertainment, and home furnishings.
It therefore comes as little surprise that the global online home decor market is estimated to grow at a compound annual growth rate (CAGR) of almost 13% between 2020-2024 with revenue of over $80 billion.
Dampening the Christmas Spirit?
Unsurprisingly, over half of all U.S. consumers are anxious about shopping in-store this holiday season. The vast majority have health and safety concerns, with 71% being the most worried about dealing with others who aren’t taking the virus seriously. This is closely followed by being around, or too close to others in stores.
Therefore, when it comes to physical shopping, people feel more comfortable in local stores or at outdoor markets and much less so in shopping malls.
Safety in Online Shopping
Considering this change in mindset, almost 60% of UK consumers said that they will be shopping online more this Christmas.
Here’s a closer look at how they plan to shop differently during the 2020 holiday season:
| Shopping In-store | Shopping Online | |
|---|---|---|
| More | 12% | 59% |
| Same | 28% | 29% |
| Less | 60% | 12% |
But while ecommerce sales are expected to spike over Christmas, delivery speeds and shipping delays are also major concerns for consumers. As a result, many of them started their shopping much earlier this year to avoid disappointment. In fact, over half of all UK shoppers had started their Christmas shopping before November had even arrived.
Bidding Adieu to 2020
The end to a painful year for many can’t come soon enough. But boarded-up storefronts, and “for sale” signs serve as a harsh reminder of the fragility of the retail sector and its reliance on consumer sentiment.
Even as we march forward guided by the hope of an effective vaccine, the future of retail remains uncertain. For consumers, their confidence will build once more, but how they choose to spend their money following the festive season will be more important for businesses and the economy than ever before.
Technology
Visualizing the Biggest Tech Mergers and Acquisitions of 2020
In a challenging year for most, many large tech companies have prospered and grown. We visualize the year’s biggest tech mergers and acquisitions.

The Biggest Tech Mergers and Acquisitions of 2020
For most businesses around the world, 2020 was a year of difficulties, lost business, and economic hardship. For Big Tech, it was a boon.
After COVID-19 hit hard in March, tech companies started to see their customer bases and revenues grow at an increased rate as people were stuck at home and utilizing their services.
Since down markets are the perfect time to consolidate, 2020 also saw big tech companies take the opportunity to grow their business with major mergers and acquisitions (M&A). After a quieter year in 2019 that saw tech investment activity dip, it was a resurgence to expected form.
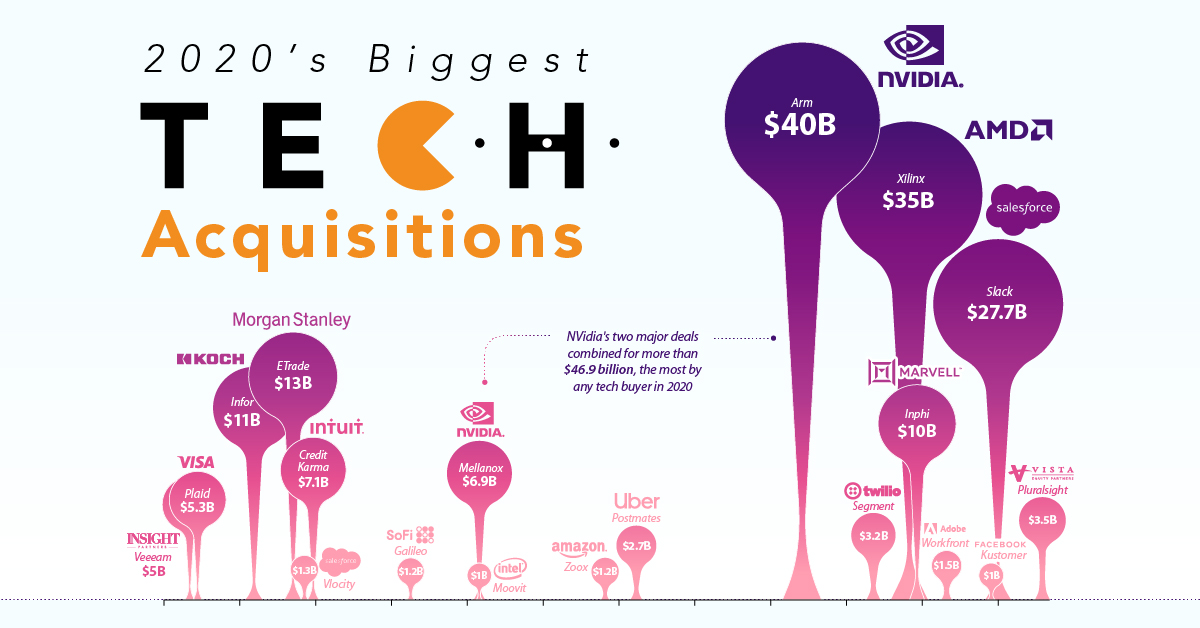
In this graphic, we visualize the year’s biggest tech deals above $1 billion using data from Computerworld, which tracked the year’s biggest acquisitions.
Deal Activity from the Get-Go
Though 2020 was all about COVID-19 and its impact on the market, the tech sector had major deal flow even before the pandemic began.
By the end of February, six of the 19 biggest tech mergers and acquisitions of the year had already occurred—and the month of February alone saw the most major deals of any month with four.
The first deals of the year were also some of the biggest. Morgan Stanley’s purchase of online brokerage E*TRADE for $13 billion and Koch Industries’ $11 billion completed takeover of software company Infor were the 4th and 5th biggest tech acquisitions of 2020.
Other big moves included purchases from tech and payments firms Salesforce, Visa, and Intuit, as well as private equity firm Insight Partners.
The Biggest 2020 Deals Were Saved for Last
After a quiet March, only a few large deals occurred from April to the summer.
Nvidia’s $6.9 billion purchase of network chip producer Mellanox Technologies in May was more than a year in the making, and Uber’s $2.65 billion acquisition of food delivery rival Postmates in July significantly consolidated the U.S. food delivery scene.
As it turned out, the biggest deals of 2020 were back-loaded for the end of the year. Just under half of 2020’s billion-dollar tech M&As happened from September‒December, including the year’s three largest tech acquisitions:
| Date | Purchaser | Acquired Company | Amount (Billions) |
|---|---|---|---|
| 2020-09-13 | Nvidia | Arm | $40.0 |
| 2020-10-27 | AMD | Xilinx | $35.0 |
| 2020-12-01 | Salesforce | Slack | $27.7 |
| 2020-02-21 | Morgan Stanley | ETrade | $13.0 |
| 2020-02-04 | Koch Industries | Infor | $11.0 |
| 2020-10-29 | Marvell Techonology | Inphi | $10.0 |
| 2020-02-28 | Intuit | Credit Karma | $7.1 |
| 2020-05-04 | Nvidia | Mellanox | $6.9 |
| 2020-01-13 | Visa | Plaid | $5.3 |
| 2020-01-09 | Insight Partners | Veeeam | $5.0 |
| 2020-12-14 | Vista Equity Partners | Pluralsight | $3.5 |
| 2020-10-12 | Twilio | Segment | $3.2 |
| 2020-07-06 | Uber | Postmates | $2.7 |
| 2020-11-10 | Adobe | Workfront | $1.5 |
| 2020-02-25 | Salesforce | Vlocity | $1.3 |
| 2020-04-07 | SoFI | Galileo | $1.2 |
| 2020-06-26 | Amazon | Zoox | $1.2 |
| 2020-05-04 | Intel | Moovit | $1.0 |
| 2020-11-30 | Kustomer | $1.0 |
Of the 19 deals over $1 billion tracked above, Salesforce and Nvidia were the only companies to make multiple major acquisitions. And although tech saw gains across the sector, most of the major M&A activity was centered around semiconductors.
As 2020 winds down, the market focus on tech is expected to last into 2021. However, the markets and the world at large continue to deal with COVID-19.
The rollout of vaccines has put the world on a timeline to reach a post-COVID era. How will the tech landscape be affected?

-
 Technology1 month ago
50 Years of Gaming History, by Revenue Stream (1970-2020)
-

 Technology6 days ago
Switch to Success: 20 Years of Nintendo Console Sales
-
 Misc3 weeks ago
Chart: A Global Look at How People Spend Their Time
-
 Markets2 weeks ago
The Year in Review: 2020 in 20 Visualizations
-

 Financing2 months ago
The 25 Largest Private Equity Firms in One Chart
-
 Healthcare2 weeks ago
Tracking COVID-19 Vaccines Around the World
-

 Leadership2 months ago
The World’s Most Influential Values, In One Graphic
-

 Markets1 month ago
5 Big Picture Trends Being Accelerated by the Pandemic